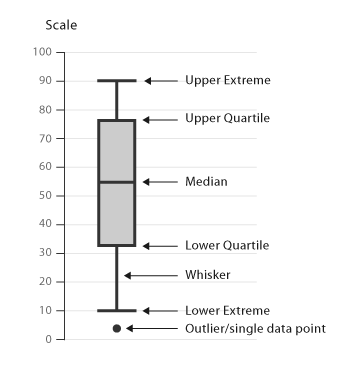
A box plot is a graphical depiction of the distribution of data based on the five-number summary in statistics:
Outliers, which are observations that lie an abnormal distance from other values, can also be shown on a box plot. |
 |
A box plot is a graphical depiction of the distribution of data based on the five-number summary in statistics:
Outliers, which are observations that lie an abnormal distance from other values, can also be shown on a box plot. |
|